Computerized Motorcycle Testing
Computerized Motorcycle Testing
An On-Board Computer Revolutionizes CYCLE WORLD’s Testing Program
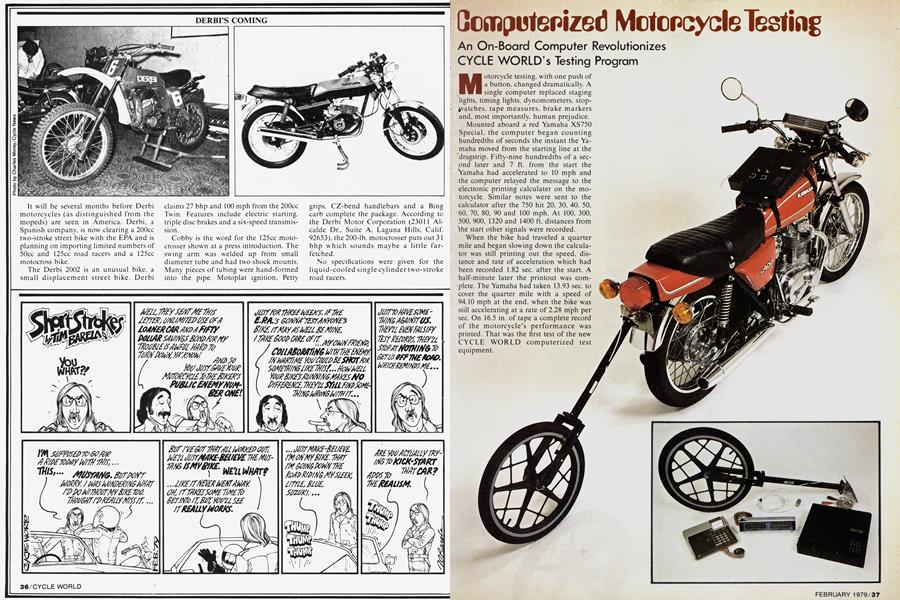
Motorcycle testing, with one push of a button, changed dramatically. A single computer replaced staging lights, timing lights, dynomometers, stopwatches, tape measures, brake markers and, most importantly, human prejudice. Mounted aboard a red Yamaha XS750 Special, the computer began counting hundredths of seconds the instant the Yamaha moved from the starting line at the dragstrip. Fifty-nine hundredths of a second later and 7 ft. from the start the Yamaha had accelerated to 10 mph and the computer relayed the message to the electronic printing calculater on the motorcycle. Similar notes were sent to the calculator after the 750 hit 20, 30, 40, 50, 60, 70, 80, 90 and 100 mph. At 100, 300, 500, 900, 1320 and 1400 ft. distances from the start other signals were recorded. When the bike had traveled a quarter mile and began slowing down the calculator was still printing out the speed, distance and rate of acceleration which had been recorded 1.82 sec. after the start. A half-minute later the printout was complete. The Yamaha had taken 13.93 sec. to cover the quarter mile with a speed of 94.10 mph at the end. when the bike was still accelerating at a rate of 2.28 mph per sec. On 16.5 in. of tape a complete record of the motorcycle’s performance was printed. That was the first test of the new CYCLE WORLD computerized test equipment.
Inside the 13 by 13 by 2.5 in. box strapped to the bike was the latest version of a microprocessor designed by Paul Lamar of Lamar Instruments. The microprocessor. as it sat on the bike, could measure speed, time, distance, acceleration and do it in combinations such as measuring quarter mile acceleration or stopping distance from a given speed.
Why use a computer? It provides more information and more accurate information. Until now there have been no accurate acceleration curves, only approximations based on quarter mile times and speeds. With the on-board computer we now have accurate, repeatable figures showing how long it takes a motorcycle to accelerate to any speed or from one speed to another. The dragstrip was good enough to show, for instance, that a Suzuki GS750 is faster and more powerful than the Yamaha 750. However until the new test equipment arrived, we didn’t know that the Yamaha 750 accelerates faster to 30 mph or 60 mph. Now we know that it takes a Yamaha 750 2.45 sec. to accelerate from 40 mph to 60 mph. That’s just the beginning.
Touring riders want to know how motorcycles will pull in high gear. Until now the only answer was to take comparable motorcycles out on the highway and make high gear roll-ons. The results couldn’t be quantified and the testing required at least two bikes and much time. Now CYCLE WORLD can find out the rate of acceleration for any motorcycle at any speed with the push of a button. The results will be repeatable, understandable and comparable.
Any motorcycle can be tested with the new equipment. No longer are motorcycles bound to a quarter mile for testing. An on-board computer can test motocross bikes, enduro bikes or even operate timing lights on a track and compute resuits from the times. The only limit to its uses is our imagination.
Lamar is working on new programs now. The next advance will be a program to measure rolling resistance. That may be the most important information. Given resistance, mass and acceleration, the computer can calculate horsepower. Not engine power or a theoretical power or a claimed power but the actual power the rear tire sends to the track. And the power can be measured at any engine speed.
Rolling resistance is useful for other purposes. We will be able to measure the changes in rolling resistance with different fairings, windshields or other accessories added to a motorcycle.
Another accessory being adapted to the test gear is a fuel flow meter. Our present fuel mileage test consists of a 100 mile loop combining city and freeway travel. Sometimes traffic changes and the results change accordingly. With a fuel flow meter we can determine the actual mileage at any constant speed or any constant rate of acceleration or any other use. The fuel flow meter can also be used to evaluate accessories and measure efficiency of engine modifications.
Further down the road are tests for suspension compliance and heat sensors which Lamar is developing now. The results will measure real world performance and will be especially valuable in comparing accessories.
The Equipment
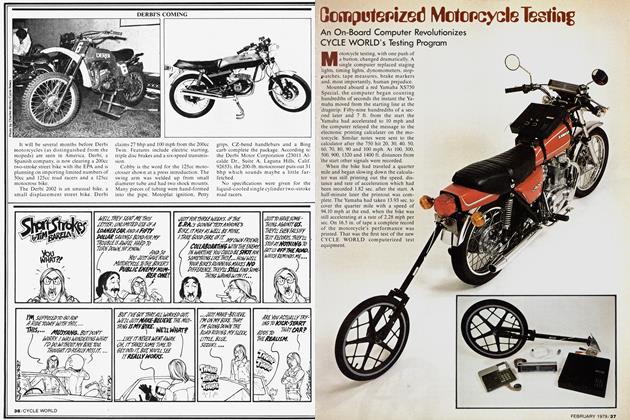
A third wheel. 60 in. around, mounts to the rear of a test bike with a flexible coupling. It weighs only 8 lb. Around the rim of the wheel are 250 alternating white and black spots which optically trigger the computer. The spots break each foot traveled into 100 segments. A wire connects the trailing wheel to the computer which incorporates an MOS Technology MCS 6502 microprocessor array that provides data and program storage. Fastened on top of the computer is the calculator, which allows the computer to print out the information stored inside. A liquid crystal display mounted to the handlebars displays time, distance, speed and acceleration rate as the motorcycle is accelerating or stopping. The entire package weighs 15 pounds and draws less than 2 amps off the motorcycle battery or an auxiliary battery pack on motorcycles not equipped with a battery.
Once the equipment has been strapped to a test bike, there’s no need for any other test equipment. A rider runs up to the starting grid at Orange County International Raceway, punches a Start button on the computer, snaps his faceshield, puts it in gear and he’s ready. Staging lights, timing lights and the rest of the drag strip paraphernalia aren't needed.
When the rider is ready he revs the engine and feeds out the clutch as fast as he can without bogging the engine or spinning the rear tire. Three upshifts later, on most bikes, and the liquid crystal display flashes 1320 ft. as the bike passes the center light at the end of the quarter mile. But the rider doesn’t slow down; he shifts into high and continues until the lefthand figure on the LCD shows 20 sec. Then he slows down and returns to the start.
During one acceleration run the Lamar computer collects 65.000 individual units of information. The actual program, determining what the computer does with the information, is stored on tape cassettes which are transmitted to the computer with a cassette tape recorder. A base 16 hexadecimal language is used to program the computer using the keyboard built into the computer.
Because the computer reads time and speed almost instantaneously, the times and speeds recorded by the computer are not exactly the same as those recorded by conventional timing lights at a dragstrip. When a bike stages at a dragstrip, it can stage shallow or deep and can end up with lower ETs by correct staging. Thus, the numbers from the timing lights don’t indicate the actual performance of the motorcycle. Because the Lamar instrument begins counting th^ instant the motorcycle moves, the numbers are more accurate, though slightly higher. Similarly, the dragstrip timing lights measure speed over a
132 ft. distance and the trap speed is actually an average speed the motorcycle was traveling through that distance. The computer simply records the actual speed the motorcycle was traveling at the 1320th foot from start.
By eliminating the advantages of staging at a dragstrip, the results are more equitable for different motorcycles. Rider skill has become less important and the figures better indicate motorcycle performance rather than rider performance. When the system is fully developed, it will deliver far more objective evaluation of not just motorcycles but accessories.
Our objective in acquiring the computer test gear was to provide more information and better information for the most important part of the magazine.
The Tests
Not only are acceleration figures provided by the computer, but speedometer error and braking figures are shown. The computer cuts time needed for these tests. Previously brake tests required mounting a solenoid-operated device which blasted a chalk mark on the pavement when the brakes were applied. The rider would stop in the shortest distance possible and a second person measured the distance from the chalk mark to the stopped motorcycle, reloaded the marker and the procedure began again. With the computer, a microswitch fastened to the brake pedal triggers the computer to begin counting distance.
The rider simply stops as fast as he can and the computer prints out the stopping distance.
Speedometer error figures are just as easy. The liquid crystal display indicates actual speed which can be compared to indicated speed. One run provides all the information necessary.
The Data Panel
Because new information is available, the CYCLE WORLD data panel which accompanies each test is being revised. First the new data panel will only be used > for street bikes. Later, a new data panel for dirt bikes will be included.
Gone is the column of suspension information. When motorcycle suspensions were, in general, less effective, the suspension dynos provided good information about the shortcomings. That was four years ago. Today all motorcycle suspensions are more sophisticated. The best forks have valving which isn’t tested on the fork dyno. Forks with air caps which allow a rider to determine the effective spring rate and shocks with adjustable damping both allow more flexibility than the dyno charts show. Suspension dynos served a purpose. They taught CYCLE WORLD editors and readers to separate shock damping from spring rate and to understand which characteristics could be expected from which specifications.
Replacing the suspension dynos will be other information. Wheel travel, front and rear, will be listed. Tire brands will be included with tire size. Differences between tires were explained in the two CYCLE WORLD tire tests (Aug. 1978 and Jan., 1979) and differences in performance can be partially explained by tire brands.
Gross vehicle weight rating and load capacity are included. The GVWR figure comes from the factory. In many cases the GVWR will indicate the maximum load carrying capability of the tires and can be changed by tire changes. Load capacity is a calculated figure, the test weight of the motorcycle with a half tank of fuel subtracted from the GVWR. In some instances adding the maximum allowable load to a motorcycle will overload parts of the bike, such as putting the full load over or behind the rear tire and not utilizing the load capacity of the front tire. The final addition to specifications is headlight type and wattage. A growing number of motorcycles are being equipped with bright quartz-halogen lamps. The brighter lights are advisable for people who do much night riding.
Acceleration figures will be changed the most. Zero to 30, 40, 50, 60, 70, 80, 90 and 100 mph times will be included. Because the maximum speeds in gears, previously included in the acceleration chart, are calculated, not actual numbers, those figures will be listed separately and not included on the chart.
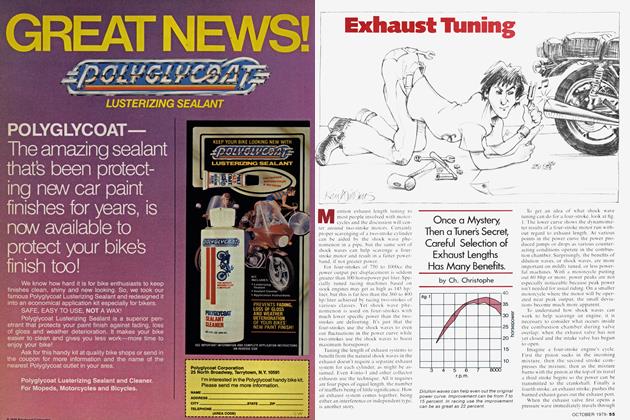
Biggest change on the data panel will be the acceleration curve. But it won’t look particularly unusual. In the past the graph ran to 60 seconds and included speeds to 120 mph. Because motorcycles have become more powerful and faster, some graphs have been revised to 150 mph. In future street tests the graphs will be all the same, each one reading to 20 sec. because the computer printout gives information up to the 20 sec. point. Speeds will be shown to 150 mph on all graphs so that the curves will be comparable. By stretching the time increments, differences in curves will be more clearly apparent. And the differences will be real with every point from the printout being used to plot the graph.
As for the rest of the specifications chart, the figures are a mixture of factory information and our own measurements. Wheel travel, brake size, wheelbase, fork rake angle, trail, handlebar width, seat height and width, footpeg height, ground clearance, test weight and weight bias are measured. Some of the figures are subject to interpretation. Wheelbase can change with chain adjustment and load. The bikes are measured unloaded and with the chains adjusted as delivered, that is, with little chain stretch. Obviously, with a loaded motorcycle such specifications as seat height, footpeg height and ground clearance will change. And on most big street bikes produced today, there’s considerable variation in some measurements. For instance, saddle height can vary by several inches. For the data panel it’s measured at the center of where a rider would normally sit. Width is measured at the same location. Peg height is measured to the center of the pegs, a compromise between measuring clearance to the bottom and distance from the seat to the top.
One of the more surprising (to us) discoveries made with the new equipment was our own mental limits. We have been testing with stopwatch and tape measure, at the dragstrip. for too long. We think as we’ve learned to think until now, as we suddenly remember that we can time from a rolling start. We can measure top gear acceleration or the time it takes to pass a 50-mph truck, or ... we expect to be coming up with new and better tests for some time in the near future.
Yesterday motorcycle tests were seat-of-, the-pants opinions about motorcycles, supported with basic facts and figures. Today a computer makes motorcycle testing more impartial and honest by collecting quantified information. Tomorrow a computer will be necessary to gather information that we don’t know exists today.S