Gearing
GEARING
How And Why Gear Ratios Are Chosen, And What You Can Do To Improve The Situation
Carl Shipman
RIDERS OFTEN change gearing to affect the performance characteristics of a bike. In doing this, it helps to know the intent of the designer when he selected the stock gearing. You can sometimes discover this by poking around in some data, which saves you the expense of a long-distance phone call or the bother of learning a foreign language.
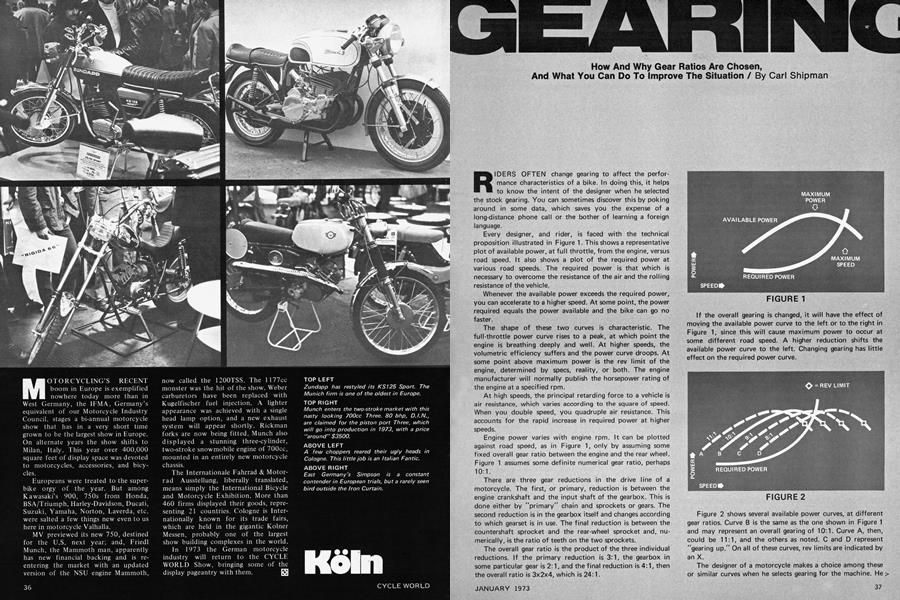
Every designer, and rider, is faced with the technical proposition illustrated in Figure 1. This shows a representative plot of available power, at full throttle, from the engine, versus road speed. It also shows a plot of the required power at various road speeds. The required power is that which is necessary to overcome the resistance of the air and the rolling resistance of the vehicle.
Whenever the available power exceeds the required power, you can accelerate to a higher speed. At some point, the power required equals the power available and the bike can go no faster.
The shape of these two curves is characteristic. The full-throttle power curve rises to a peak, at which point the engine is breathing deeply and well. At higher speeds, the volumetric efficiency suffers and the power curve droops. At some point above maximum power is the rev limit of the engine, determined by specs, reality, or both. The engine manufacturer will normally publish the horsepower rating of the engine at a specified rpm.
At high speeds, the principal retarding force to a vehicle is air resistance, which varies according to the square of speed. When you double speed, you quadruple air resistance. This accounts for the rapid increase in required power at higher speeds.
Engine power varies with engine rpm. It can be plotted against road speed, as in Figure 1, only by assuming some fixed overall gear ratio between the engine and the rear wheel. Figure 1 assumes some definite numerical gear ratio, perhaps 10:1.
There are three gear reductions in the drive line of a motorcycle. The first, or primary, reduction is between the engine crankshaft and the input shaft of the gearbox. This is done either by "primary" chain and sprockets or gears. The second reduction is in the gearbox itself and changes according to which gearset is in use. The final reduction is between the countershaft sprocket and the rear-wheel sprocket and, numerically, is the ratio of teeth on the two sprockets.
The overall gear ratio is the product of the three individual reductions. If the primary reduction is 3:1, the gearbox in some particular gear is 2:1, and the final reduction is 4:1, then the overall ratio is 3x2x4, which is 24:1.
FIGURE 1
If the overall gearing is changed, it will have the effect of moving the available power curve to the left or to the right in Figure 1, since this wilt cause maximum power to occur at some different road speed. A higher reduction shifts the available power curve to the left. Changing gearing has little effect on the required power curve.
FIGURE 2
Figure 2 shows several available power curves, at different gear ratios. Curve B is the same as the one shown in Figure 1 and may represent an overall gearing of 10:1. Curve A, then, could be 1 1:1, and the others as noted. C and D represent "gearing up." On all of these curves, rev limits are indicated by an X.
The designer of a motorcycle makes a choice among these or similar curves when he selects gearing for the machine. He> has some latitude in selecting what he wants to use, and will be guided by several considerations.
For a touring bike, with an abundance of power, he may choose simply to select top gear so that, at normal highway speeds, the engine is loafing along at 3 or 4000 rpm. This promotes long engine life, gives the rider surplus power for passing and climbing grades, and makes for relaxed riding. This is represented by curve B.
It will be evident that going uphill or riding into a headwind has the effect of moving the required power curve upward on the graph because gradient or wind increases the power required at all road speeds. Going downhill or with a tailwind moves the curve downward.
It should be apparent that curve C gives the highest maximum speed because the required power curve passes through the peak of the available power curve. The machine can be geared to have less top speed than this, but never more, assuming a level road and no wind.
A designer choosing curve D might be worried about the rider exceeding the rev limit of the engine. If the machine is geared to produce curve D, there is practically no way—not even downhill with a tailwind—that the required power curve could move downward enough to allow overrevving.
Curve A is automatically ruled out because it allows overrevving on a level road. The over-enthusiastic stop-light racer can achieve this gearing very simply, if he chooses to. Also, a capable designer, under duress from the sales department, can produce a machine geared according to curve A, as we will see.
You can get an idea of the gearing of a bike by looking at specs and road test data. Typically, touring bikes with lotsof power gear something like curve B. High-performance motorcycles and bikes with small engines tend to use gearing like curve C.
Here are some examples:
The Harley-Davidson Super Glide develops 65 brake horsepower at 5400 rpm. Top speed is 117 mph at about 6000 rpm. At 70 mph, in top gear, engine speed is only 3500 rpm. It looks like curve B.
The three-cylinder Suzuki 380 shows peak horsepower at 7500 rpm. Top speed is 98 mph at about 8000. This is close to curve C.
The Honda CB100 churns 11.5 bhp at 11,000 rpm. Its top speed is 71 mph at about 10,700 rpm. Another curve C.
Having selected the overall ratio for top gear, the designer then has to worry about the bottom gear. Again, he has to do so in consideration of the type of bike and its intended use. For other than racing bikes, he wants to provide a low gear which allows easy acceleration from a stop without a lot of engine revving and clutch slipping. Also, he wants to provide a gear which will allow the motorcycle to climb steep hills. In both cases, this is influenced by the amount of power available, the shape of the power curve and, in general, by the size of the engine. Little engines require high ratios in bottom gear. The 100cc Yamaha LS2 has a bottom overall ratio of 37:1. The 650cc Triumph Bonneville has a low-gear ratio of 13:1.
On race bikes, low gear tractability is sacrificed, for reasons which will be apparent later. You have to push the bike, rev the engine and slip the clutch to get it even to pull at low speeds. Nobody cares because this bike is not expected to chug
around much. With a limited number of gears in the gearbox, the designer doesn't want to waste one for low speeds.
Having selected an overall gear ratio for top and bottom, the problem now is to fill in between with intermediate gears. There are wide-ratio gearboxes, close-ratio gearboxes, bikes with only three gears and bikes with six or more. There must be a reason for all that variety. The reason is the nature and intended purpose of the machine.
Figure 3 dwells on this aspect of the problem. It shows a torque curve and a power curve for an engine. What an engine develops, basically, is torque, which is defined as a force acting along a circular path. Torque is expressed in pound-feet, where pounds are the force and feet are the radius of the circular path. Gear reduction serves to multiply torque. Given the torque rating of an engine (at a particular rpm), we can figure the force that the tire exerts on the ground as follows:
F = 3£
R
where F is force in pounds, T is engine torque in pound-feet, G is the gear reduction, and R is the rolling radius of the wheel. Typically, R is near 1 ft. Thus, if a bike has an engine torque of 20 lb.-ft., a gear reduction of 15, and a wheel radius of 1 ft., the force between tire and surface would be 300 lb.
Power introduces time as a factor. A simple analogy is shoveling sand. If you fill the shovel full, it takes more force to lift it and you will therefore shovel slowly. If you fill the shovel less than full, you can lift it easier and therefore shovel faster. It is conceivable that you could shovel more sand by taking small loads very fast than by taking big loads very slowly.
FIGURE 3
In Figure 3, as rpm increases past the torque peak, the torque falls off at some rate. But, the rpm is increasing at a higher rate than the torque is falling off. So, the net work performed increases even while the torque is decreasing and the power curve continues to climb. Eventually, torque decreases faster than rpm increases and power begins to suffer.
A lightly-stressed engine with low power for its displacement will normally have the torque peak and the power peak pretty far apart on the rpm scale. In some cases, the torque peak rpm may be only about half of the power peak rpm (2000 and 4000 rpm as an example). When an engine is tuned like this, both curves will be "flat,'' meaning gently rounded on top rather than rising to a sharp peak.
Motorcycle engines generally yield fairly high horsepowerper-cubic-inch figures and race bikes yield exceptionally high specific power ratings. The way we do this is to perform magic with carburetors, inlet and exhaust timing, resonant inlet and exhaust tracts, and other secret maneuvers in order to get high torque at high rpm. Then, the engine is not only lifting big shovels of sand, it is also doing it very fast. This causes the torque peak and the power peak to be very close together on the rpm scale. An example might be torque peak at 9500 rpm and power peak at 10,000 rpm. The interval is only 500 rpm, which is 5 percent of 10,000.
All of this leads toward the "spacing" of the gears in the box. If the top gear ratio, overall, is 10:1 and the bottom ratios is 40:1, then the designer has to decide how many gears to put in between and what their individual ratios should be. He could consider, for example, 30:1 and 20:1, and the result would be a four-speed gearbox. We will see, however, that 40, 30, 20 and 10 would not be a good choice, even though it appears to be neat, simple, and orderly.
When working up through the gears, it is desirable to arrange gearing so the engine stays somewhere near the peak of the power curve. Otherwise, performance suffers. You can run out of power in a gear, or it can sag badly between gears.
This requires definition of a "power band," as shown on the power curve in Figure 3. There isn't any fixed definition of it. The power band is simply how far off of peak power you will tolerate at the high end and low end of each gear.
Imagine that the curve of Figure 3 represents 2nd gear, that you have just shifted out of low gear, and that this has dropped you on the "X" which marks the low end of the power band. Now, you will run the revs up to the top end of the power band and shift into 3rd. Ideally, when you let the clutch out in 3rd gear, this will land you back again at the bottom of the power band. The result is that you have nearly maximum power in every gear and the bike will be pleasant to ride.
For big-inch, conservatively designed engines such as were used in old cars, a rule of thumb was to arrange the gearing so that the rpm in each gear extended from the peak of the torque to the peak of the power. That sounds slick. With each shift, you drop from the point of maximum power to the point of maximum torque and start climbing back up again. If these rpm values are 4000 and 2000 rpm, respectively, then the power band is defined as being 2000 rpm wide, which happens also to be 50 percent of the 4000 rpm figure. This means that the change in gear ratios, working from the highest number to the lowest, should also be in steps which are 50 percent. Figure 4 helps you understand that, maybe.
A series of numbers which is developed by multiplying the first number by some constant to get the second number, and so forth, is called a "geometric progression." Example: 1, 3, 9, 27, 81. The intervals seem to get larger if you are counting on your fingers. However the intervals, as percentages, are constant. In every pair of adjacent numbers, the smaller is always 33 percent of the larger.
Obviously, to use the same width of power band in each gear, the gear ratios must change by a constant percentage at
each step. The percentage is the width of the power band divided by the rpm at the high end of the power band, times 100.
Gearbox designers think a lot about geometric progressions, and would like to use them when they select ratios, but the real world doesn't always allow it.
Because motorcycle engines are generally highly tuned, the torque peak is near the power peak, as we said. The difference may be 5 to 15 percent. If you try to use such a small percentage as the interval between gears in the gearbox, it requires many of them. For example, if we want to span the distance between a low gear of 40:1 and a top gear of 10:1, using intervals of 10 percent, we wind up with a series of gear ratios. The first is 40. The second is 10 percent less, which is 36. It looks like this: 40, 36, 32.4, 29.2, 26.3, 23.7, 21.3.... Already we have used seven gears and are only at 21.3.
What you are seeing is the reason tiny road-racers, like Grand Prix 50cc machines, use lotsof gears, perhaps 10 or 12. Because they have a power band which is only a few hundred rpm wide, they use lots of intermediate gears to try to stay on that narrow band, and they still won't run at low speed.
Since you know that most ordinary bikes use four, five or six speeds, you can guess that this may be enough for ordinary purposes.
FIGURE 5
Figure 5 shows how Yamaha uses five gears in each of two bikes. One bike is the 125cc AT-1C which isa general purpose trail or enduro bike. The other is the 125cc AT-1 MX, which is the same machine set up for motocross, with different gearing. The numbers illustrate several things, including wide-ratio versus close-ratio gearing, departure from geometric progression, and compromises in gearing necessary to adapt a bike to a specific purpose.
It takes a minute to get acquainted with the chart, so I'll just wait while you do that. Now, if you are ready, notice that the overall gearing on the AT-1 ranges from a high of 40:1 down to a low of 10:1. The ratio of these ratios is four, which produces wide-ratio gearing. On the MX version, the high and low numbers are 33:1 and 11:1, a range of three instead of four. These ratios are closer to each other and is close-ratio gearing.
Primary reduction, as you can see, is the same on each model. They didn't change those gears. Final reduction (between sprockets) is lower on the MX version. This is only a change in sprocket teeth.
For the AT-1, the change between 4th and 5th is 20 percent. This is an attempt to keep near the power peak when changing, up or down, between these gears. The interval > between 2-3 and 3-4 is about 30 percent, which defines a wider power band and therefore utilizes less engine power at the extremes of operation in these two gears. The 1-2 change is a whopping 38 percent, which means that low gear was pushed way down there in order to provide a better hillclimbing capability.
Now, let's look at what Yamaha did to make this machine into a motocrosser. The overall ratio in top gear changed from 10 to 11, about 10 percent. This gives 10 percent more acceleration, if other things stay the same. At the bottom, the overall ratio changed from 40 to 33, which is about 20 percent. The span of gearing was narrowed, and it was “pulled in" more at the bottom than at the top. This means that first-gear performance is not important—normally you only use it once at the starter's flag.
By sacrificing the “stump-pulling" low gear, the intervals between 1-2, 2-3 and 3-4 are nearly geometric. They are 32 percent, 26 percent and 29 percent. The 26 percent is probably the handiest tooth combination they could get in that box by changing only one gear of a pair. Because these ratios are separated geometrically, the performance will not change much, gear to gear. Each gear uses an rpm range which is about 30 percent of the peak power rpm. On this bike, the torque peak is 11.4 lb.-ft. at 7500 rpm and the power peak is 18 bhp at 8500 rpm. Thirty percent of 8500 is about 2500, so the “power band" used in these gears may go from 7000 rpm to 9500 rpm or thereabouts, with less power at the ends than in the middle.
On the MX version, the change between 4-5 is only 6 percent, which is intended to allow the rider to stay right on top of the power curve. The top speed of this machine is specified as 70 mph. This suggests that the designer, by providing the small interval between 4-5 and therefore favoring operation in these gears, envisioned motocross happening at around 60 mph.
We can speculate that it might have been better to put the small interval between 3-4, or possibly to reduce the 2-3 and 3-4 intervals and make the top ranges all geometric.
Now that you're thinking about close-ratio gearing, put these numbers in your computer. The five-speed 400cc Husqvarna has the following overall gear ratios: 18.44, 15.49, 13.06, 11.0 and 9.27. How close is that?
The intervals are 17 percent, 16 percent, 15 percent, 15 percent, approximately. Since this bike has excellent low speed performance, it must have a very broad power band so that you can work these close geometric ratios at the peak, but also have power well below the peak power rpm. If so, then the machine has to be conservative in terms of horsepower per unit displacement. It is.
If two engines are designed about the same in terms of port or valve timing, carb size (relative), and compression ratio, then power will depend very closely on engine size. Husky claims 41 bhp out of 400cc, which is about 1 bhp for each 10cc. The Yamaha DT-2 (not MX) claims 24 bhp out of 246cc, also about 1 bhp for each 10cc. The Husky is about as highly tuned as a Yamaha Enduro.
If you were paying attention, you noticed above that I implied that the Husky and the Yamaha had about the same compression ratios. If you are also the type who remembers published compression ratios, then you know that Husqvarna advertises a CR of 10.2 whereas Yamaha talks about only 6.8.
This difference is more a case of how the CR is measured rather than any actual difference in compression pressures at the top of the stroke. Husqvarna uses the entire travel of the piston to calculate CR, ignoring the fact that ports are open when the piston is at the bottom. The Japanese, perhaps more realistically, compute CR after the piston has closed the ports. In CYCLE WORLD, November '71, J.G. Krol flogs this subject with his customary thoroughness and technical depth even including, believe it or not, some genuinely funny technical humor. By that I mean numbers that are funny, not funny words about numbers. If you're curious, read it. This paragraph didn't have anything to do with the subject but I put it in to avoid letters to the editor commencing with the word “dummy."
Trials bike gearing is interesting, showing how the designer can adapt to the intended purpose of the bike. Lowest gearing, overall, on 250cc trials iron runs near 40:1. Numbers like 40:1 are normally associated with smaller engines, such as 100 or 125cc. Other (normal) 250cc bikes don't gear down that much. The Suzuki 250 is about 20:1 in low gear and the DT-2 is about 24:1. Obviously, the trials designer intends for his 250cc scooter to be able to climb up cliffs, if there is traction.
The intervals in a trials box are also tailored to the sport. In a five-speed there are, of course, four intervals. Typically, the bottom two are around 25 percent and the top two around 33 percent. Most sections in a trial are run in 1st or 2nd gear and the rider tries to avoid changing gears in a section. If he needs to go really slow, he will use 1st. If the terrain is slippery, he will use 2nd, hoping to avoid wheelslide by putting less torque to the ground. The higher gears are normally used for running around between the sections, although 3rd is often useful on hills.
An interval of 25 percent sounds like it might allow a considerable drop-off from peak power. One might wonder, if the low gears are so critical to trials riding, why the interval is not smaller. The reason lies in the shape of the power curve, which is nearly flat, and the high overall gear reduction. There is more than enough power in either gear. Using 2nd allows the rider to put down less force on the surface, as mentioned, for a given throttle setting. If you ride one of these machines, it feels like a tractor at any rpm in the lower gears.
The ultimate question is, "What can a guy do about all this?" If the designer did a good job, and you are riding the bike the way he expects you to, there is probably little to gain in changing gearing.
However, if you are after top speed and conclude that your machine is presently geared like curve B in Figure 2, you could gear up and try for curve C.
If you are after acceleration, you can gear down at some sacrifice in top speed. When you lose top speed, you lose it only in one region—flat out in top gear. You still have all the other speeds except the ones you lost. When you modify for acceleration, you get increased acceleration at all speeds, up to whatever top speed the machine will go.
Also, if you gear down, you will shift at road speeds that are closer together. Assume a bike is geared so that 6000 rpm produces a speed of 34 mph and 8000 rpm produces a speed of 45 mph. This happens to be an overall ratio of about 12:1, and could be 4th gear on a small bike. If 6000 to 8000 is the power band, and the rider stays in it, he will change speed by 11 mph in that gear.
If another bike of the same model is geared down by 10 percent, each of the two speeds above reduces by 10 percent. They become 30.6 and 40.5, and the difference reduces to 9.9 mph.
In a race from A to B, one of these two bikes would get there first, depending on how important top speed is. Figure 6 relates to this. It shows a plot of speed versus time and, for convenience, shows speed increasing and decreasing instantaneously. When the time is 1 hour, the speed of this object suddenly increases to 10 mph, where it remains until the time is 3 hours. This object traveled at 10 mph for two hours, and therefore covered a distance of 20 miles.
FIGURE 6
The point of this exercise is to observe that the area enclosed by this plot has significance. Since it is a rectangle, the area is easy to figure. It is height times length. In other words, multiply 10 mph times 2 hours and the result is 20 miles distance. The resuitis also the area of the rectangle.
The area under any curve of speed versus time has the same significance, whether the figure thus formed is a rectangle or not.
FIGURE 7
Figure 7 illustrates a race between these two bikes, one geared down by 10 percent. It is another plot of speed versus time. The solid line represents the bike that was geared down. Its maximum speed is less, but it gets up to that speed in a shorter time. The dotted line is the speed of the stock bike. It accelerates more slowly, but finally arrives at a higher top speed. The curves are exaggerated for clarity.
Who wins depends on how long the race is. If the finish is at the time designated by A, we determine the distance traveled by estimating the area under the curve for each bike. Both of these curves are effectively closed by the finish line because coasting past the finish doesn't count. Obviously, the area under the solid line is greater than the area under the dotted line. So, the modified bike traveled a greater distance in a fixed amount of time.
Now, let's have a longer race, over to B. The stock bike wins, as you can see. In fact, the guy on the stocker might have won even more dramatically if he had geared up to get still more top speed.
If you determine that a bike is not geared for what you want it to do, you can sometimes improve it by changing the gearing.
A good example of some of the things we have been talking about turned up in the CYCLE WORLD road test of the 750cc Norton Commando, torque peak at 6000 rpm, power peak of 65 bhp at 6500 rpm. This is a high-performance motorcycle and you would expect the overall gearing to be something like curve C, back in Figure 2 (this is the one that puts the required power curve right through the peak of the available power curve, to generate maximum possible road speed). It isn't. And, there are some other strange things.
FIGURE 8
The red line is at 7000 rpm, but CW was able to get a top speed of 116.7 mph out of it at an rpm of 7385. This is curve A, which we said that nobody but stoplight racers would do. It is possible to run this bike beyond its rev limit on a level road.
Also, by looking at curve A, it is very plain that this bike is capable of more than 116.7 mph with proper gearing. The clue is in the write-up of the CW test. In Europe, the machine is delivered with a 21-tooth countershaft sprocket. For delivery to the United States, they tailor it to market demand, install a 19-tooth sprocket and convert it into a wild charger. In the test, CW had trouble keeping traction with the rear tire. "Top gear acceleration from roughly 80 mph upward is almost unbelievable...."
Changing the sprocket by two teeth out of 21 is about 10 percent. It will have the effect of moving the available power curve to the left by 10 percent. Suppose we put the two teeth back on. This would cause the power peak of 6500 rpm to correspond to a road speed of about 121 mph, and it is likely that the machine could reach that speed. This would return the bike to the performance indicated by curve C, as the designer intended all along. The curious behavior of this machine, with U.S. gearing, is shown in Figure 8. EB